
How do you know your power skills training is actually working?
Most programs can track attendance, completion rates, post-session satisfaction. But ask who actually improved and by how much, and the data goes dark. That’s not because L&D teams aren’t paying attention. It’s that they’re being asked to prove something that resists easy measurement. You can’t sit in on every one-on-one between a manager and a struggling employee. You can’t quantify a hard conversation the way you can a sales number. And yet leadership wants a number anyway: some way to show that a very human skill set is actually improving.
That’s the gap Mursion closes. For more than a decade, Mursion has given people a safe place to practice hard moments, from calming a frustrated customer to coaching a defensive employee, before the moment really counts. But simulation practice is only half of it. Every simulation also produces a signal: whether the goal was hit, how specific skills were rated, whether the person came back to try again. String those signals together, and the conversation stops being “did we run the training?” and becomes “did it work, for whom, and what should we focus on next?”
The nuance most people miss: progress does always look like a straight line
Real growth doesn’t look like a staircase. It looks like a scribble that trends upward.
Picture three attempts at a tough feedback conversation. Attempt one: solid. Attempt two: a swing and a miss. Attempt three: breakthrough. That’s not a fluke. That’s what skill-building actually looks like, in a simulator or anywhere else. Progress is jagged. Some reps dip below the one before. That’s not failure. That’s how people learn.

So Mursion doesn’t ask “did this attempt beat the last one?” We ask a better question: did your ceiling move?
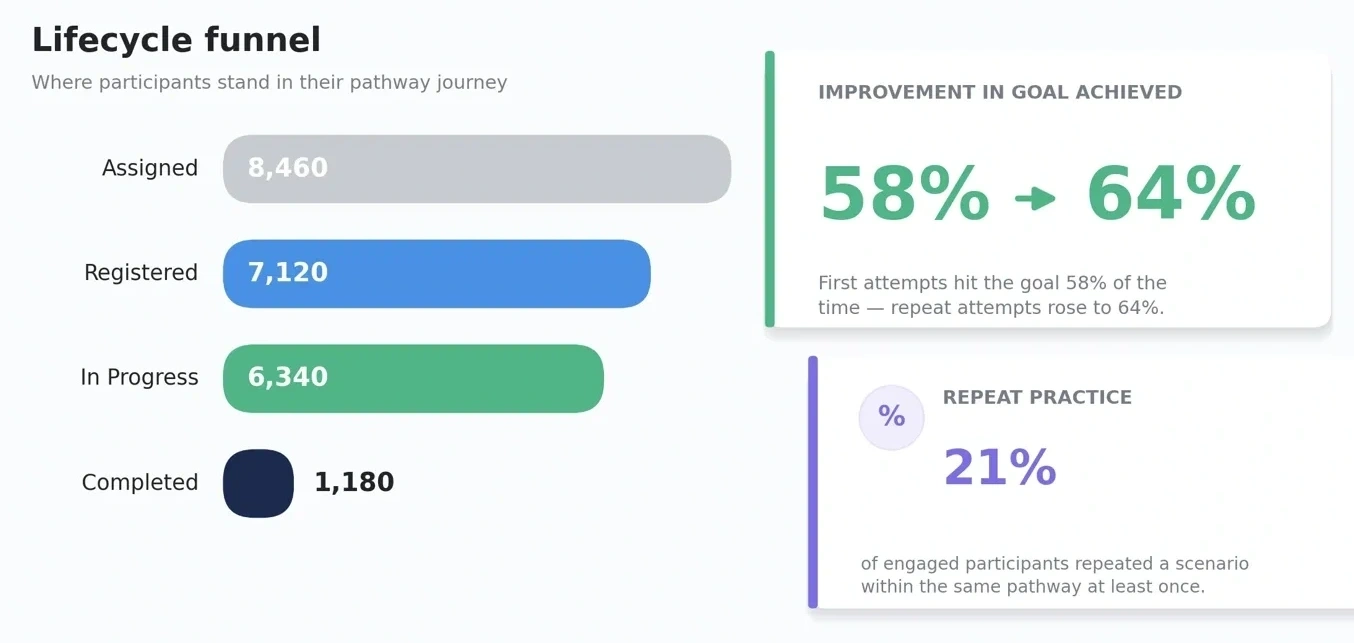
First attempt vs. best attempt cuts through the noise of an off day or a bold experiment and shows you the thing that actually matters: real capability growth, not daily variance. Across cohorts, the pattern holds up. People who come back for a third or fourth practice hit their goals at meaningfully higher rates than they did on day one, even when not every attempt in between was a step forward. The trend proves the growth.
This isn’t just a better way to measure. It’s what makes Mursion work. This is a space built to fail safely. That means someone who already nailed a conversation one way should feel free to come back and try something riskier: a new opening, a tougher pushback response. That attempt might score lower. It’s not backsliding. It’s exactly the behavior the whole model exists to reward. First-vs-best protects that space. It means trying something new on attempt three never gets mistaken for a failure, because what counts is the best you’ve shown, not an unbroken streak of wins.
From attendance to impact
Once you’re tracking growth instead of just activity, three things become possible: tracking engagement, growth, and momentum
You can see who’s actually engaging, not just enrolled. Mursion tracks participants through every stage: assigned, in progress, completed. Layer in the first-vs-best comparison, and coming back for another attempt stops being a vanity metric and becomes evidence of growth, without turning a rough first try into a strike against anyone.
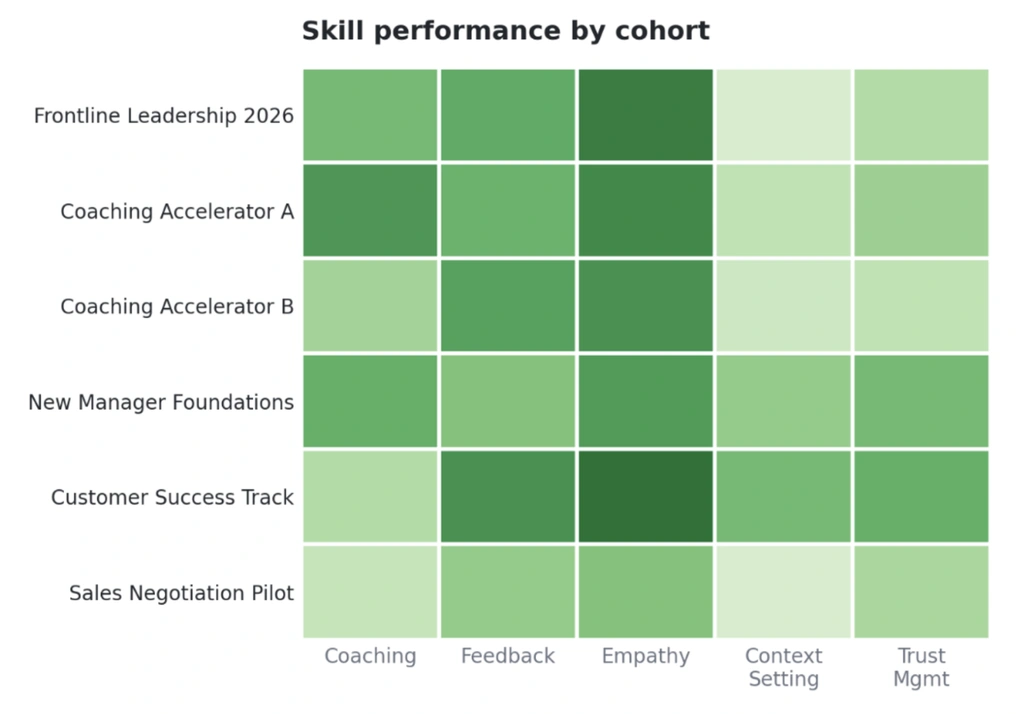
You can see exactly where the skill gaps are. Instead of a vague sense that a team “needs better communication,” you can see which specific skills are strong and which need more work, broken down by cohort. That’s the difference between a loose development goal and an actual plan.
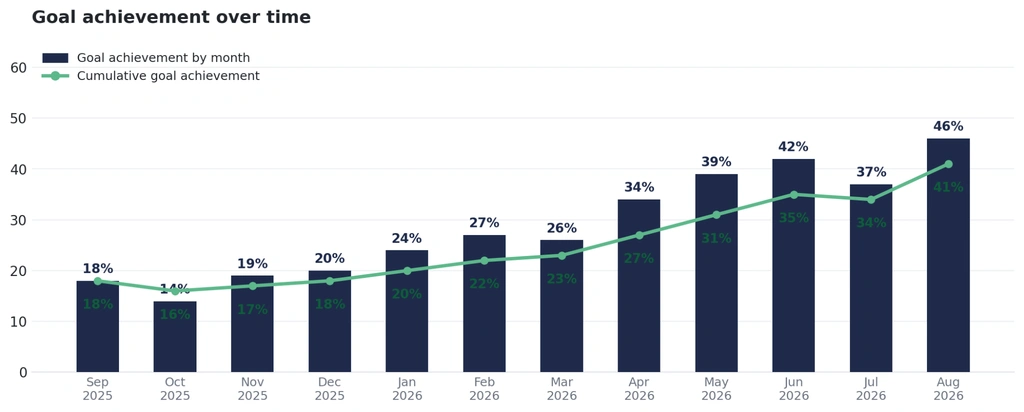
You can catch momentum shifts early. Month-over-month trends surface where a team is pulling ahead or falling behind, so you can make real adjustments long before the annual review, when it’s too late to matter.
Generic roleplay gives someone a moment to practice. Mursion gives you complete visibility into how skills evolve over time, across an entire organization. That’s what lets L&D leaders celebrate what’s working, and know where your investment is leading you.
Want to see what growth tracking looks like for your team? Request a demo.